How to share plotagraphs in a blog post?
Since I’m posting a plotagraph today, I though I would also show you how I include it in the blog posts.
I use the video HTML tag to include the MP4 versions of the plotagraph. Of course if you just export it from Plotagraph, it would be too big, so first I compress it using Hanbrake transcoder (which you can get for free here), where I just use the default settings to recode the file. A file of 1200×800 px then ends up between 0.5 to 1.5 megabytes in size.
Then I use the tag in this form:
‹video poster=”link to image that shows while the video is loading” autoplay=”autoplay” loop=”loop”›
‹source src=”link to the video in mp4 format” type=”video⁄mp4″ ⁄›
Your browser does not support the video tag.
‹⁄video›
You have to fill in the poster, as you need to show some image while the video is loading. Also the image shows when on mobile, as mobile browsers don’t load mp4 videos in pages. Also, if a older browser is used, they will only see the text message that you specify there. The autoplay part is for the video to start automatically on load and the loop will force the video to loop indefinitely.
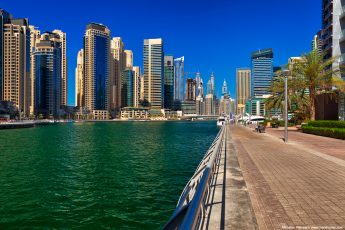
Sunset clouds in Dubai – Plotagraph
I have not posted a plotagraph in a long time, so how about one. This one is created from a photo I took few years ago at the Burj Al Arab in Dubai. The sunset was great that day, and having the possibility to add a bit of movement here, really adds to this photo.
(if you are on a mobile or use an older web browser, you may only see a static image)


Leave a Comment